
TEST REPORT
This document summarises a pre-test carried out on the Yaesu FT1000 MP MKV Field. The purpose
with this pre-test was to investigate the CW keying sidebands from the transmitter. This is due to reports that unwanted key-clicks should be present during transmitting in CW mode. A study and analyse if sidebands are sufficiently suppressed will prove if this could be the cause of the reported problem. If the reported key-clicks is caused by the sideband keying, the test should also prove
or verify if a change to the rise and fall time of the keying pulses had any influence on the first result.
Equipment Under Test
EUT 1: Yaesu Tranceiver FT1000MP MKV Field
Serial Number: 2J100101 (un-modified and modified version)
EUT 2: Wireless Set No. 19
Serial Number: 10050
Manufacturer: Philco Corp USA
Test results
The keying sidebands from Wireless Set No. 19 is presented in figure 3 below. The result can be compared with the result in figure 1 representing the unmodified FT1000MP MKV Field, and the result in figure 2 representing the same EUT but modified with reference to Mr Tom Rauch, Ohio USA
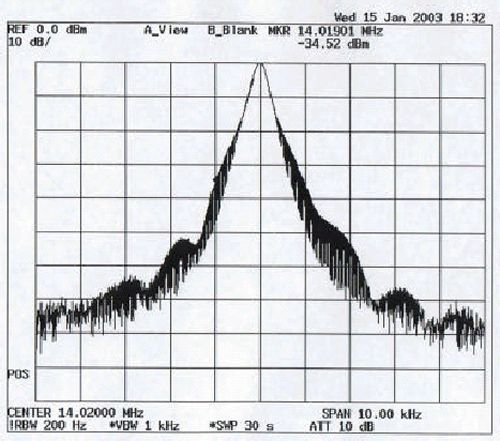
Figure 1
This picture shows the unwanted sidebands presented by the spectrum analyser for the un-modified EUT. It conforms to the result from the ARRL test report and their Expanded laboratory test. The value is produced by a continuously string of dots at a speed of approximately 60-WPM. The result shows
significant spectra of widen sidebands. Marker position is at -1 kHz and –34.52 dBc.
Note
ARRL test report, Expanded laboratory test can be down loaded from:
(http://www.arrl.org/members-only/prodrev/pdf/lab/mark-v-field.pdf)
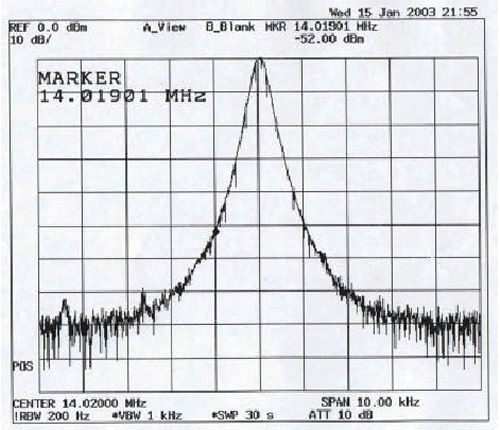
Figure 2
This picture shows the unwanted sidebands presented by the spectrum analyser after the modification. The sidebands are here according to the plotted curve reduced to –52 dBc. This is according to the plotted curve an improvement by at least 18 dB. Marker position is at -1 kHz and –52.0 dBc.
Remarks
It has to be pointed out that due to built in limitations in the measuring equipment (Spectrum analyser minimum 200 Hz filter), the actual improvement is not only 18 dB but at least 30 dB. This is far better than the presented plotted curve in figure 2. The 30 dB figure was achieved with help of a Test Receiver equipped with a 125 Hz crystal filter. Unfortunately we could not produce a plot with the actual value.
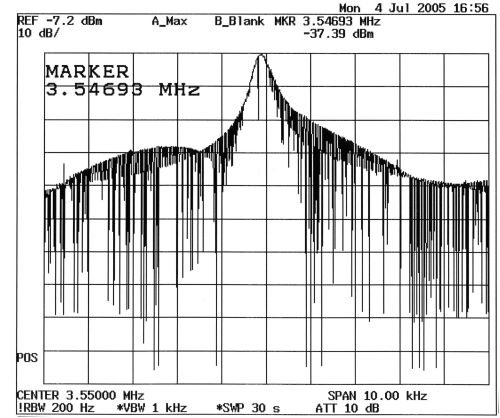
Figure 3
Shows the unwanted keying sidebands from Wireless Set No. 19 presented by the spectrum analyser.
The value is produced by a continuously string of hand keyed dots at a speed of approximately 20-WPM. Key clicks at - 1 kHz is down some 26 dB and at + 1 kHz only 18 dB.
--
Harmonics from the Wireless Set No. 19
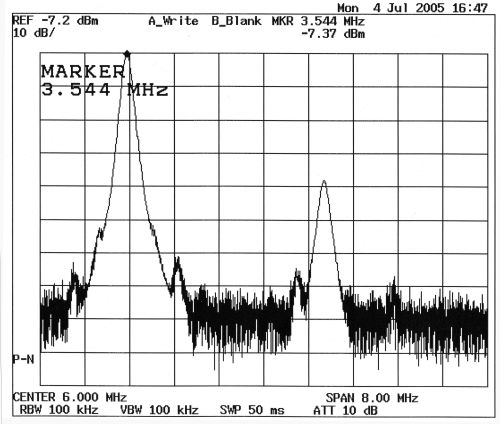
Figure 4
3.544 MHz signal represent 6 Watt power output. Second harmonic, 7088 kHz was 39 dB down.
List of test equipment
Spectrum Analyzer Advantest R3272
Oscilloscope National
Power Directional Coupler HP
3 dB Power Divider Mini Circuits
Test Receiver Standard Radio CR91
Power meter Bird Trueline 43
Dummy Load 600W Bird 8401
Attenuator variable 0...120 dB Pascall
Attenuator pad fixed 20 dB HP
Function Generator Exact